MAGNETIC TRANSPORT SYSTEMS (MTS) HAS BEEN INSTRUMENTAL IN THE DESIGN AND DEVELOPMENT OF A GAME-CHANGING BREAKTHROUGH RAILROAD TECHNOLOGY
MagRail Technology - Phase 1
What is it?
- A low-cost electromagnetic railroad propulsion alternative that is zero emissions and 2-1/2 times cheaper than diesel.
- Substantially reduces track and wheel wear and maintenance.
- No changes needed to existing rolling stock and track.
- No dangerous overhead catenary wires or hot third electric rails.
- Particularly suited for:
- Dense urban environments where air and noise pollution are important considerations.
- Long uphill terrain where large amount of fuel is consumed.
- In long tunnels where adequate combustion air for diesel operation is lacking.
How it works:
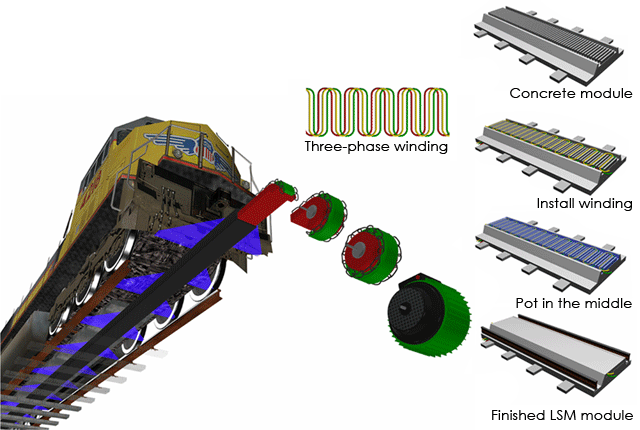
Key building blocks of MagRail's Linear Synchronous Motor (LSM)

- Linear Synchronous Motor is nothing more than a conventional rotary motor with the field laid flat.
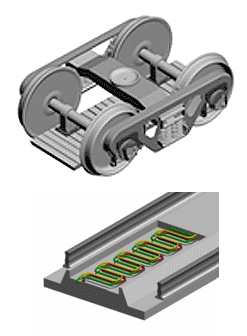
- LSM modules are three-phase electric windings encased in a modular
 concrete beam (~18 ft. in length).
 - Motor modules are connected end to end and attached to the top of the crossties of existing railroad tracks. Electrical block switches are used to power the section of track where the vehicle is located. When powered from the electric grid, the LSM motor winding creates a
 magnetic flux.
 - The magnetic flux interacts with the permanent magnets mounted beneath a railcar's bogie or helper locomotive and provides the propulsion to move one or more railcars or an entire train.
- The vehicle is controlled by an all-weather propulsion control system that maximizes efficiency.
- A safety-certified train protection system provides supervisory
 control for operational safety.
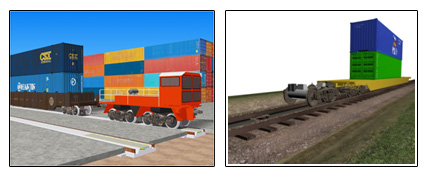
 - Existing locomotives and/or helper railcars can be mounted with the magnets or MagRail helper cars can be hooked to existing trains for propulsion.
Financial Benefits
| Assumptions | |
|---|---|
| Miles | 100,000 |
| $/gallon diesel | $3.95 |
| $/kWhr electrical | $0.1097 |
| Tons-mile/gallon (diesel locomotive) | 480 |
| Tons-mile/kWhr (MagneRail) | 33.60 |
| Conversion Ratios: | |
| BTU/kWhr | 3,412 |
| BTU/gallon diesel | 138,690 |
| Calculation: | |
| Diesel Locomotive | |
| (gal. diesel/480 tons)*($3.95/gal. diesel)*100,000 | $823 |
| MagneRail | |
| (kWhr/33.6/tons)*($0.1097/kWhr)*100,000 | $326 |
| MagneRail Energy Cost Compared to Diesel = | 40% |
|
Source of Energy Costs: U.S. Energy Information Agency http://www.eia.gov/oog/info/gdu/gasdiesel.asp |
|
- The cost of diesel fuel is 2-1/2 times more costly than comparable electric energy costs. (See Addendum for source of electric and diesel costs).
- Substantially reduces wear and tear on the wheels and tracks as the propulsive force is not related to rail/track adhesion.
- Substantial reduction in maintenance cost as there are no moving motor parts to wear out.
- Complies with EPA Tier 3 and Tier 4 emissions standards without the need to purchase new locomotives.
- Installation costs similar to adding overhead catenaries.
Social Benefits:
- Zero emissions.
- Eliminates much of the noise caused by the interaction between the wheels and track.
- Collisions between trains are impossible.
- No risk of electric shock as only the motor section below vehicle is energized during operation.
Operational Benefits
- Able to traverse 10% grades.
- Regenerative braking produces energy to supplement the operation of the system.
- Capable of moving individual railcars or entire trains remotely or by on-board operations.
- Can maintain train headways by as little as thirty seconds.
- Allows railroads to become compliant with the more stringent Tier 3 and Tier 4 air emissions guidelines for port operations that will be mandated by local and federal air quality agencies by the year 2020.
- Faster acceleration and braking.
- Capable of very high speeds.
Addendum:
1. Source of Diesel Costs: U.S. Energy Information Agency 
2. Source of Electricity Costs: US Energy Information Administration
Average Retail Price of Electricity to Ultimate Customers: Total by End-Use Sector, 1997 through February 2011 (Cents per Kilowatthour) | ||||||
| Period | Residential | Commercial | Industrial | Transportation | Other | All Sectors |
|---|---|---|---|---|---|---|
| 1997 | 8.43 | 7.59 | 4.53 | N/A | 6.91 | 6.85 |
| 1998 | 8.26 | 7.41 | 4.48 | N/A | 6.63 | 6.74 |
| 1999 | 8.16 | 7.26 | 4.43 | N/A | 6.35 | 6.64 |
| 2000 | 8.24 | 7.43 | 4.64 | N/A | 6.56 | 6.81 |
| 2001 | 8.58 | 7.92 | 5.05 | N/A | 7.20 | 7.29 |
| 2002 | 8.44 | 7.89 | 4.88 | N/A | 6.75 | 7.20 |
| 2003 | 8.72 | 8.03 | 5.11 | 7.54 | -- | 7.44 |
| 2004 | 8.95 | 8.17 | 5.25 | 7.18 | -- | 7.61 |
| 2005 | 9.45 | 8.67 | 5.73 | 8.57 | -- | 8.14 |
| 2006 | 10.40 | 9.46 | 6.16 | 9.54 | -- | 8.90 |
| 2007 | 10.65 | 9.65 | 6.39 | 9.70 | -- | 9.13 |
| 2008 | 11.26 | 10.36 | 6.83 | 10.74 | -- | 9.74 |
| 2009 | 11.51 | 10.17 | 6.81 | 10.65 | -- | 9.82 |
| 2010 | 11.58 | 10.26 | 6.79 | 10.97 | -- | 9.88 |
| 2011 | ||||||
| January | 10.99 | 9.88 | 6.73 | 10.52 | -- | 9.62 |
| February | 11.20 | 10.11 | 6.72 | 10.85 | -- | 9.70 |
| Total | 11.09 | 9.99 | 6.72 | 10.68 | -- | 9.66 |
| Rolling 12 Months Ending in January |
||||||
| 2010 | 11.44 | 10.13 | 6.76 | 10.68 | -- | 9.77 |
| 2011 | 11.64 | 10.29 | 6.82 | 10.97 | -- | 9.92 |
[1] See Technical notes for additional information on the Commercial, Industrial, and Transportation sectors.
N/A = Not available.
Sources: 2006-2008: U.S. Energy Information Administratin, Form EIA-826, "Monthly Electric Sales and Revenue Report with State Distributions Report;" 1992-2005: Form EIA-861, "Annual Electric Power Industry Report."
